Content
Dashboard & Widget Overview
By default, ProPanel will only be visible to Admins and Group Leaders.
- Admins will see all data
- Group Leaders will only see data relating to the groups that they manage
NOTE: This can be extended to other roles by enabling the “propanel_widgets” capability using a role editing plugin
ProPanel contains four reporting widgets located on the WordPress backend dashboard. These widget come available when you install and activate ProPanel. You can adjust the position of the widgets by dragging and dropping them to your desired dashboard location.
Overview Widget
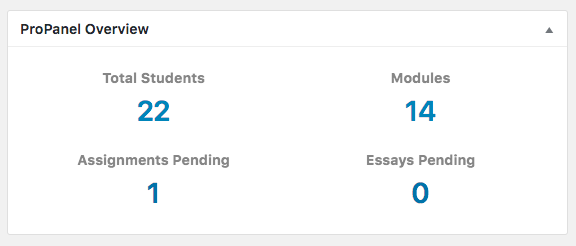
Displays the number of students, courses, and pending assignments and pending essays (to be approved by admin or group leader). Each item is a clickable link that will let you view the selected section in more details.
Activity Widget
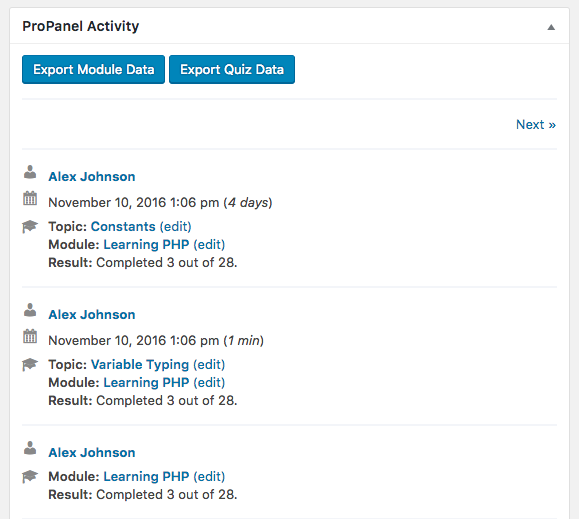
This widget displays real-time activity on your courses. Supported activities include course completion, lesson and topic completion, and quiz completion. Associated data such as timestamp, score, and steps will be displayed when applicable.
You can also export course and quiz reports via the buttons at the top of the widget. These reports will include the filtered data only.
Admins will be able to view all user activity while Group Leaders can only view activity of users who are in their group(s).
The number of items shown per page is dependent on the pagination in the ProPanel Reporting widget (see below for more information).
Reporting Widget
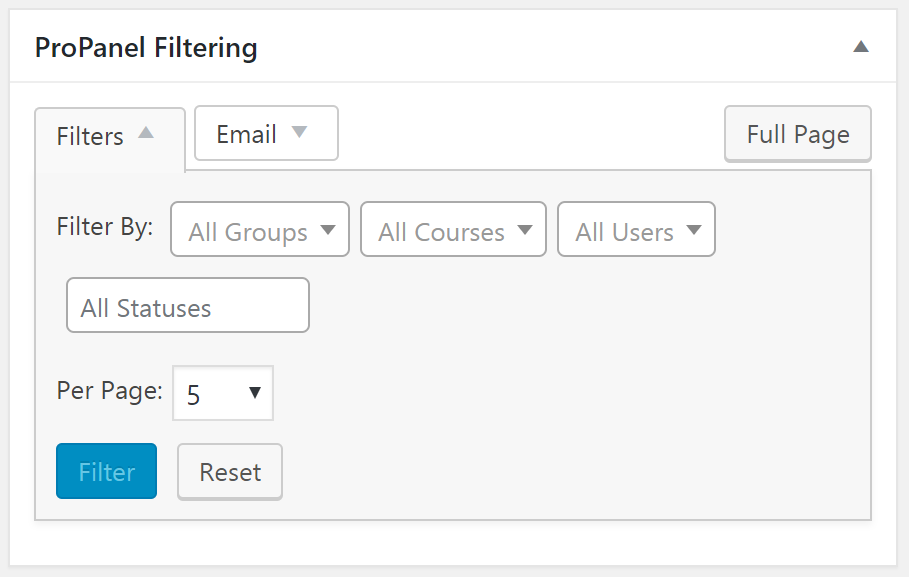
A widget that enables you to filter by course, user, and/or group. You can use any combination of these filters to narrow down your results. Below are some examples.
User Filter → Select a user → Select a progress status
This generates a list of courses in which that specific user is enrolled, along with progress statistics for those courses.
Course Filter → Select a course → Select a progress status
This generates a list of users enrolled in the selected course, along with progress statistics for each user.
Group Filter → Select a group → Select a progress status
This generates a list of users in the selected group, along with progress statistics for each user.
Additional Options
- Email lets you communicate with the users selected in the Filters section.
- Pagination will control the output of both lists in the Reporting widget as well as the Activity widget.
- Full Page will take you to a full page view of the Reporting widget for a distraction-free and full-width environment.
Chart Widget
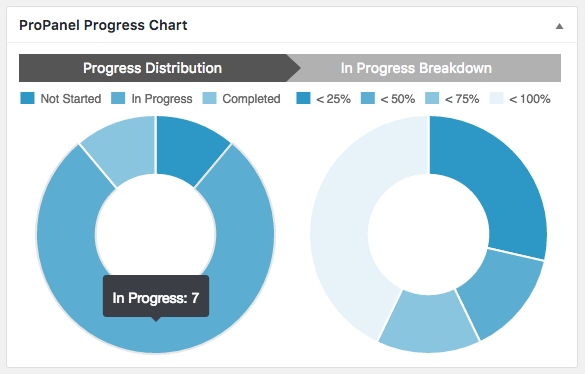
Once the ProPanel Reporting Widget is set to filter by group, course, or user, you will notice two charts appear.
On the left is the overall Progress Distribution chart. This will show user or course distribution between “Not started,” “In Progress,” and “Completed” course statuses.
On the right is a breakdown of all users or courses that are “In Progress” in the selected filter (In Progress Breakdown). By default, the in progress will be distributed in 20% increments (20, 40, 60, 80, and 100). These increments along with many other items can be changed using the filters discussed in the Developer section below.